An inside look at SAR-based measurements
Share article
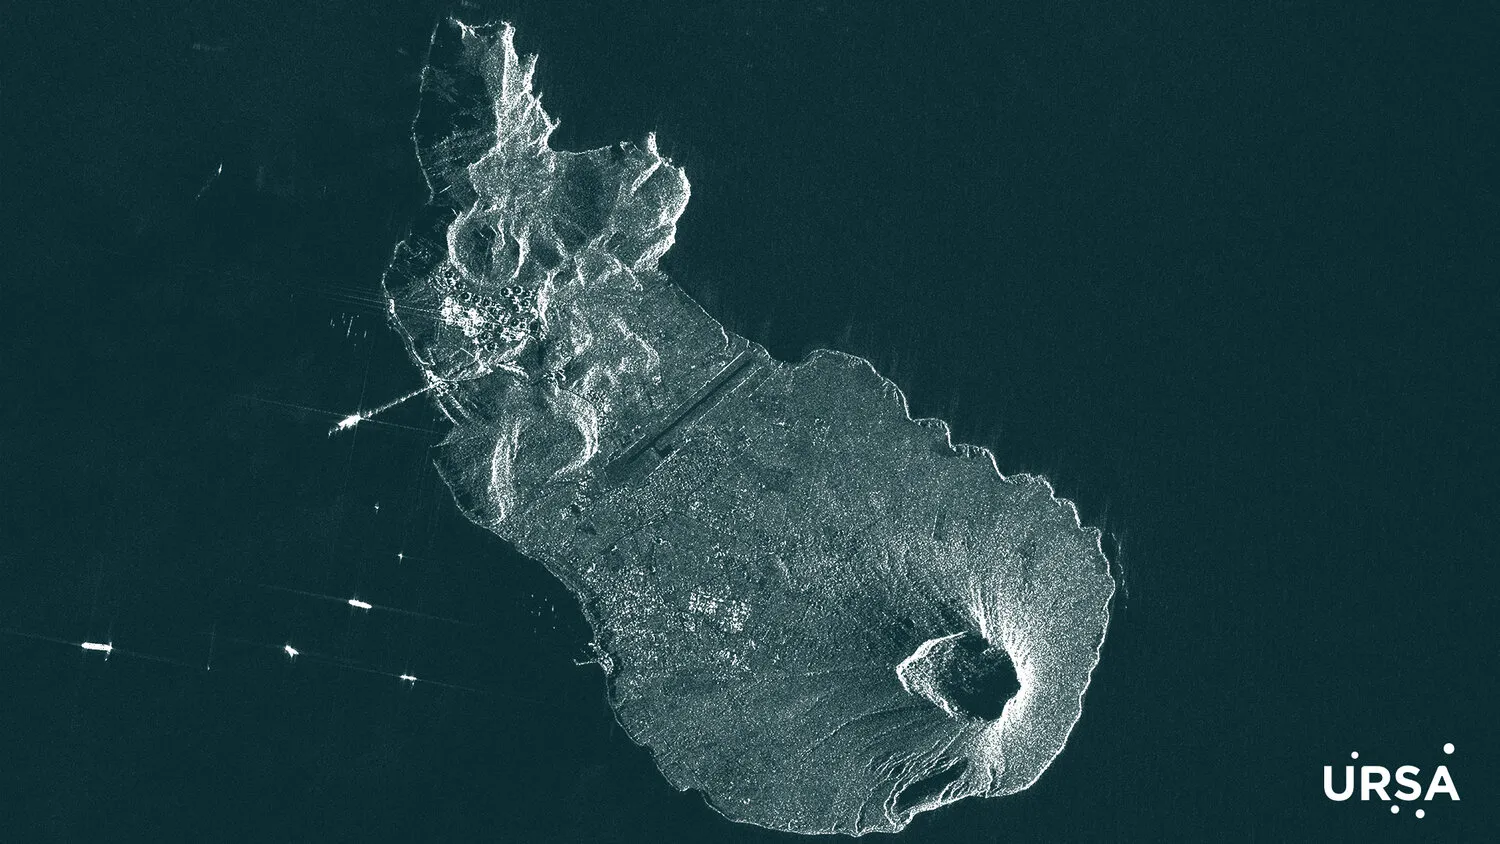

St. Eustatius
In the lifetime of Ursa Space’s Oil Storage Product, we have measured approximately 1.7 million tanks, totaling 389 billion barrels of crude oil.
That’s more oil than the world consumes over a 10 year period.
There is a hunger for this type of information because oil inventories are the best indicator of the global supply-demand balance, which in turn drives the price of oil.
But the magnitude of the task also makes it impossible to accomplish, unless you select a technique that optimizes speed and accuracy.
How do you do it? And can you apply the same process to solve other problems?
A key ingredient is satellite imagery. And lots of it.
That alone isn’t enough. You must be able to process the imagery, develop the necessary algorithms, and deliver the results in a digestible format, which is exactly what we’re doing.
The Oil Storage Product (OSP) is providing customers with a global oil inventory dataset for several years running.
Satellite imagery acquisition is critical. That means working with our suppliers to make sure the images needed to perform the measurements are scheduled and arriving as planned.
The imagery is derived from synthetic aperture radar (SAR), which works in any weather, day or night. (For an infographic on how SAR works, click here).
That capability, in addition to having multiple SAR vendors, provides a notable advantage when trying to deliver a reliable product.
The SAR image below captures an oil tank farm in Dalian, China, typical of the ones we monitor.
You might be wondering, how can you tell how much oil is in storage in this image?


Dalian, China
The analysis isn’t based on what you can see with the naked eye. Instead, it’s based on the SAR energy that returns to the satellite after bouncing off the earth’s surface.
The information can be used to form an image, which in this case is an oil storage tank with a floating lid (as opposed to a fixed roof).
The height of the lid floats up and down depending on how full the tank is.
By measuring the height of the lid, plus some of the tank’s other dimensions (e.g. diameter), we can use geometry to calculate the number of barrels inside.
Those steps are done using a proprietary algorithm that was developed in-house.
In the SAR image below, we colorized the base, floating lid and rim, and added the fill levels to help visualize the process.


Each tank-level measurement must also pass a quality control test. Once measurements pass the test, the data are immediately made available to customers via API.
We also compile the data into a weekly email sent every Thursday, containing a PDF report and CSV files. The client can scroll through the PDF report for quick takeaways, and then dig deeper using software, such as Tableau and Power BI, or the Ursa Space Portal, which includes dynamic, customizable data visualization tools.
Every Monday, we also deliver a report containing the latest inventory data for Cushing, Oklahoma, a major storage hub and the delivery point for the NYMEX WTI crude futures contract.
Oil futures prices are sensitive to fluctuations in Cushing storage levels, making Wednesday’s release of US inventory data by the US Energy Information Administration a market-moving event.
Ursa Space’s Cushing, Oklahoma measurement has a 0.98 correlation with EIA’s Cushing figure since June 2019. Having our data in-hand on Monday means clients are well-positioned to anticipate Wednesday’s EIA release.
We also issue a separate Monday report with the latest inventory measurements for key locations in the Permian Basin and US Gulf Coast, regions under scrutiny.
So, what comes next?
The doors of possibilities are wide open because the same techniques described above can be applied elsewhere.
With SAR imagery, we can measure a range of properties, such as speed, distance, width, height, direction, presence.
Some recent examples involved measuring water surface area:
-
Ethiopia is constructing a controversial dam on the Nile’s main tributary. Our measurements showing large changes in the size of reservoirs above and below the dam confirmed reports that Ethiopia had begun filling the dam.
-
Clean water supply is a major humanitarian and security topic in Iraq. Our measurements of three reservoirs in Iraq show significant fluctuations over time.
-
In two separate incidents, dams holding back mining waste collapsed in Brazil. We measured the water surface area of the reservoir and downriver basin before and after the collapse.
-
After a ship ran aground off the coast of Mauritius it began to leak its fuel. We detected the oil spill and provided regular updates on its size and location.


Mauritius Oil Spill - Use case for Ursa Space's oil spill monitoring capabilities

Brazil Tailings Dam Failures - Case study of water contamination, water-level measuring, and vegetation index capabilities
Iraq Water Supply - Examples of Ursa Space's water-level measuring capabilities


Grand Ethiopian Renaissance Dam - Examples of Ursa Space's water-level measuring capabilities
Where would you like us to look next? Please let us know.
Share article