Oil storage rising: Cushing and beyond
The amount of oil held in storage at Cushing, Oklahoma led to one of the biggest stories in the world this week.
WTI oil futures traded Monday (April 20) in negative territory for the first time ever. You got paid to buy oil.
Part of this story involves the peculiar nature of the WTI futures contract. The contract is physically settled. Barrels are delivered to Cushing, Oklahoma.
The catalyst was the realization that Cushing inventories were basically full, the result of plunging oil demand caused by the coronavirus.

But this situation is hardly confined to Oklahoma. The narrative of dwindling storage capacity has gripped the oil market.
How much room is left? And where?
Without timely or reliable public data available, outside the US, the answers come from space.

Cushing, Oklahoma
Ursa measures global crude inventories every week using radar satellite imagery. Our coverage represents more than 4 billion barrels of capacity.
Our latest measurements show global inventories at 2.5 billion barrels, or 61% of capacity.
However, the actual capacity utilization is higher because tanks cannot be filled all the way for safety and operational reasons. There is also a minimum level below which suction pumps are ineffective.
We created an interactive dashboard (click below), allowing you to visualize Ursa inventory data by country.
Every week, we compare a country’s latest capacity utilization level versus the mean. We then categorize each country as either:
-
High: One standard deviation above the mean
-
Mid: Within one standard deviation of the mean
-
Low: One standard deviation below the mean
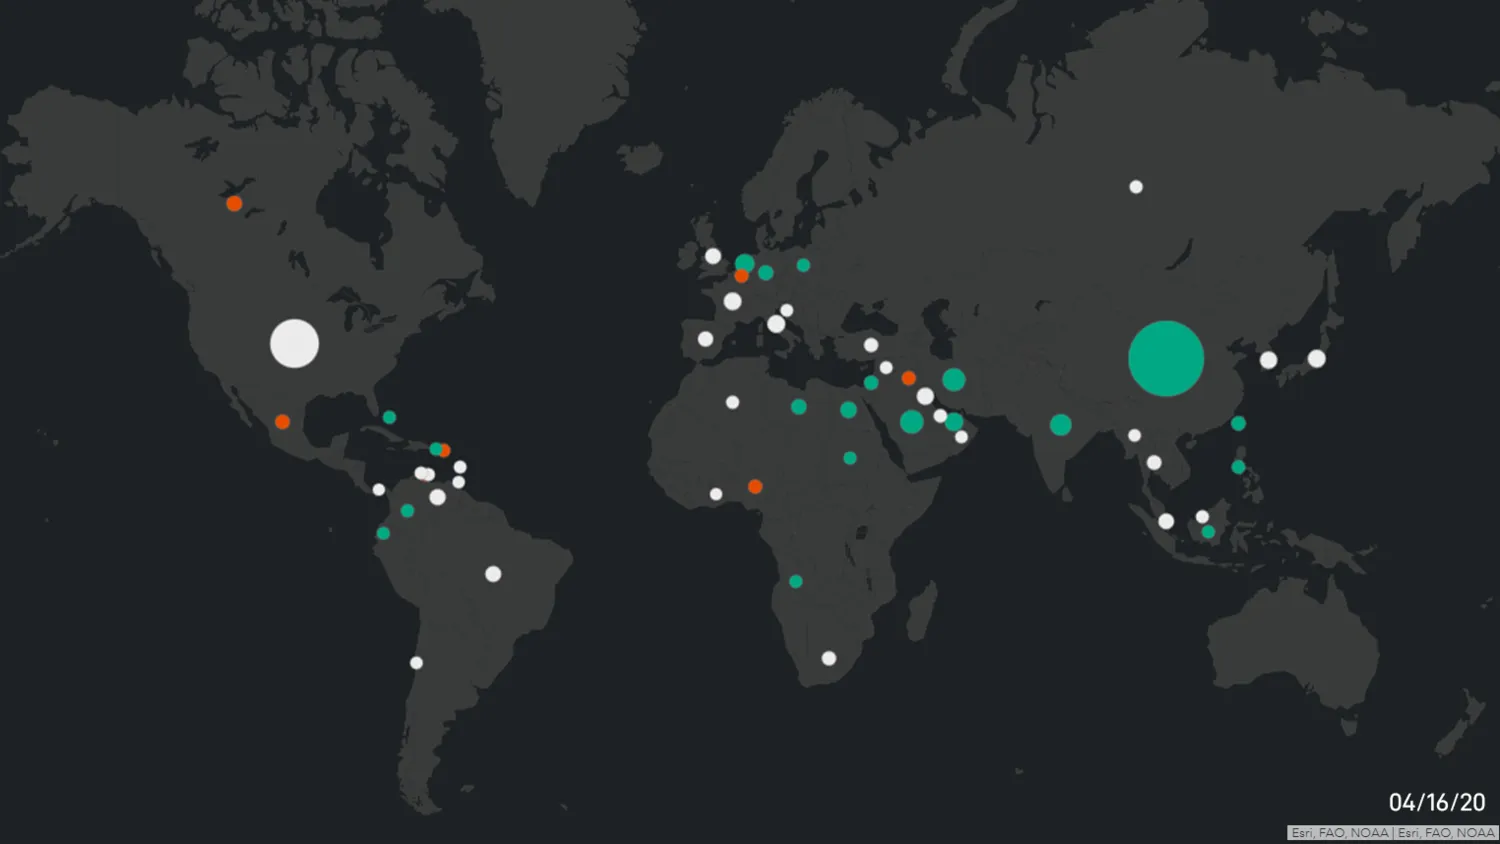
Each country is displayed with a circle colored green (high), white (mid) or orange (low).
This map shows data from April 16:

The number of countries by category:

This map shows data from March 12:

The number of countries by category:

There was a shift between these dates, with the number of countries in the High category growing from 12 to 20, a significant increase.
One country that has remained in the High category is China. Strong builds in Feb-March led to record highs, even though inventories have flattened the last few weeks.

Countries making the jump from Mid to High included Saudi Arabia, Egypt, Germany, Netherlands and India.
These countries are interesting for different reasons.
Saudi Arabia’s rising inventories could be a sign of struggles to find buyers. However, the builds coincided with a major push by Saudi Arabia to increase supply and stamp out rival producers.
Those additional barrels could’ve been held in storage in preparation for export.
One place where Saudi Arabia stores crude internationally is Egypt. That could explain why Egypt has also seen builds recently.
Again, another factor could be weak demand. Egypt serves as a gateway for Middle East supply headed to European refiners. Less demand in Europe would cause inventories to rise in Egypt.

The biggest refining complex in Europe is located in Rotterdam. With the continent in a lockdown, it’s no surprise that crude inventories would rise in the Netherlands and Germany, also home to major refiners.
In late March, India’s top refiner IOC said it reduced runs by up to 40% and closed a naphtha cracker plant. Reliance Industries (RIL), also a major refiner, said it would sell crude to prepare for run cuts in April.
This relationship between refinery runs and inventories has fueled the panic across the oil market.
Despite efforts by OPEC and Russia to limit supply, the declines in refinery demand will be far greater, causing inventories to reach maximum capacity.
It’s an issue that goes far beyond Cushing, and explains why the ICE Brent, the global benchmark, traded April 22 at $15.98/b, a low going back to June 1999.

According to our classification, most countries fall in the Mid category. As a percentage of capacity, inventories are within one standard deviation of the mean.
OPEC and Russia agreed to lower production by 9.7 million barrels per day starting in May, though the cuts might begin earlier.
But that’s roughly one-third of the estimated decline in demand caused by the coronavirus pandemic.
Unless something changes, expect inventories to keep rising. More countries will shift into the High category in the coming weeks.
We will continue to monitor these developments and provide updates on our COVID-19 Dashboard.