Supply Crunch: Global Auto Manufacturing
Share article


What is the outlook for global carmakers in 2022? To answer this question about where the industry is headed next year first requires an understanding of where things stand today.
Present conditions, as everyone is aware, have been defined by the semiconductor shortage, part of the larger story about supply chain disruptions upending businesses and everyday lives around the world.
After weathering last year’s storm when the automotive industry faced the daunting task of staying open, while keeping workers safe, it seemed like 2021 was going to be a smoother ride.
Not so. But how badly has production suffered as a result?
Let’s turn to a pair of data sources. One source is the International Organization of Auto Manufacturers (OICA), which publishes production figures collected from its members or correspondents and national trade organizations.
The other source is Ursa Space’s Auto Manufacturing Index (AMI), which is derived from satellite imagery. For more information, you can watch a short video or check out this story map.
Our coverage includes dozens of auto plants in these 13 countries:
- Americas: Brazil, Mexico, United States
- Asia: China, India, Japan, South Korea
- Europe: France, Germany, Italy, Russia, Spain, United Kingdom
For the purpose of this analysis, we therefore limited the OICA numbers to the same 13 countries, which represent approximately 80% of global vehicle production per year.
Here are the OICA numbers along with a few key takeaways:
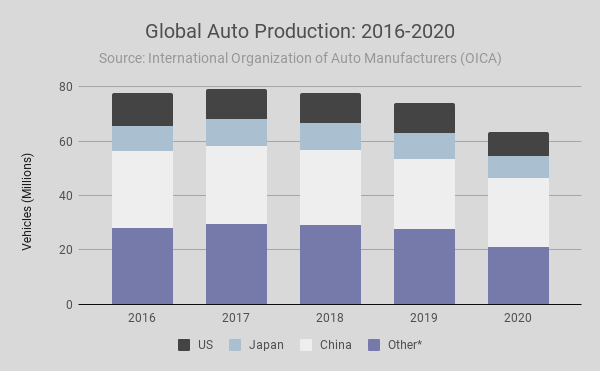
- Global auto production declined sharply in 2020, falling below 2019 totals, which were also lower than 2016-18 range.
- Production in the US and Japan was notably weaker in 2020 vs 2019, while China’s year-on-year decline was far more subtle.
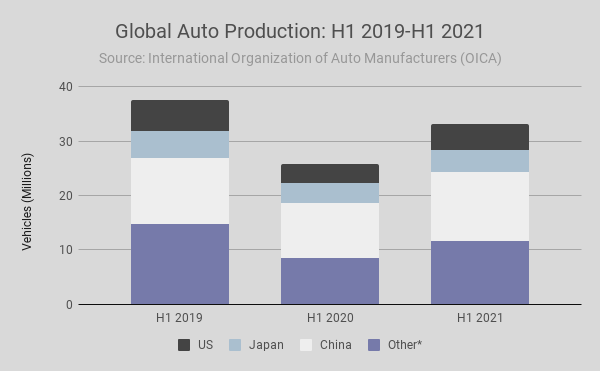
- Despite chip shortages, production managed to rebound through the first half of 2021, according OICA data.
- Global auto production was higher Jan-June 2021 compared with the same time period in 2020, and was only a hair less than H1 2019 levels.
- Data from all 13 countries told the same exact story: Production in H1 2021 was higher than H1 2020 and below H1 2019.
Is this the full story? And what about the second half of 2021?
Ursa Space’s AMI is updated on a weekly basis, using satellite imagery collected over dozens of facilities, providing a more contemporaneous view on production trends.
Manufacturers covered include all the big names, such as BMW, Changan, Fiat, Ford, GM, Hyundai, Jaguar Land Rover, Kia, Nissan, PSA, Renault, SAIC-GM, Tesla, Toyota, and Volkswagen.
With over 5 years of historical data, a baseline is established to know whether current levels are higher or lower than normal.
Similar to the Purchasing Managers’ Index (PMI), a closely-watched economic indicator, a score of 1 is an important threshold. An AMI greater than 1 denotes above-average production levels, while less than 1 suggests below-average production levels.
To compare the AMI with the OICA data, we turned the latter source into an index by dividing production numbers by an average over a given time period (e.g. 2016-2020).
Let’s take a closer look:
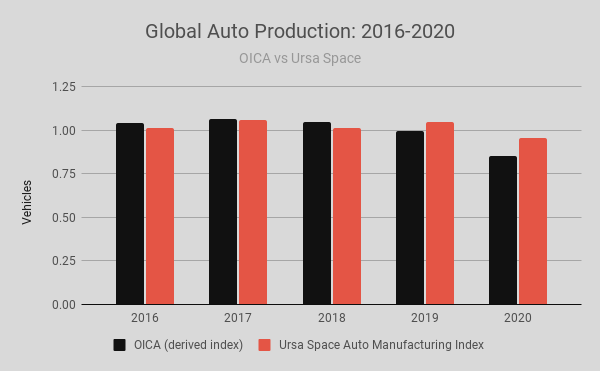
- Both the OICA data and Ursa’s AMI show stable production from 2016-2019 followed by a visible decline in 2020, unsurprising considering the turmoil of that year.
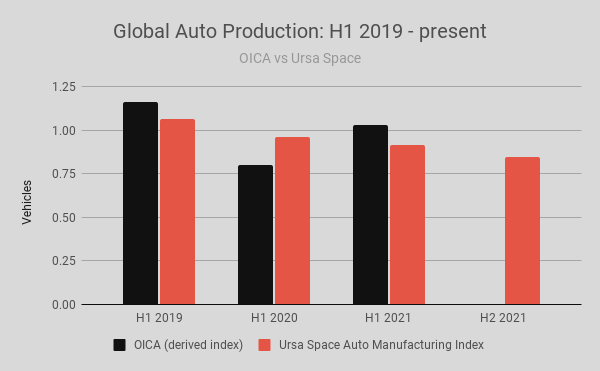
Which countries are responsible for this difference? In which countries did Ursa’s AMI show continued weakness in 2021, unlike the OICA data?
In the first half of the year, it was mostly Brazil, India and Mexico, and to a lesser extent France, Italy, Spain and the UK, while the second half of the year was mostly driven by China.
What do you think? Has 2021 seen a rebound in auto production? Or is the industry still dogged by logistical bottlenecks?
If you’d like to download a sample of the AMI data or subscribe to the product, check out our listings on AWS Marketplace or Crux.
Share article